The Division of Economic and Health Policy Research conducts independent research to support AMA federal, state and private sector advocacy agendas.
One of the division’s most significant efforts is the Physician Practice Benchmark Survey, which focuses on the practice arrangements and payment methodologies of physicians who take care of patients for at least 20 hours per week and don't work for the federal government.
The Benchmark Surveys have been conducted on an every-other-year basis since 2012. Policy Research Perspective reports, based on the surveys, provide detailed analysis of the data.
2024 Physician Practice Benchmark Survey
Medical Liability Claim Frequency Among U.S. Physicians
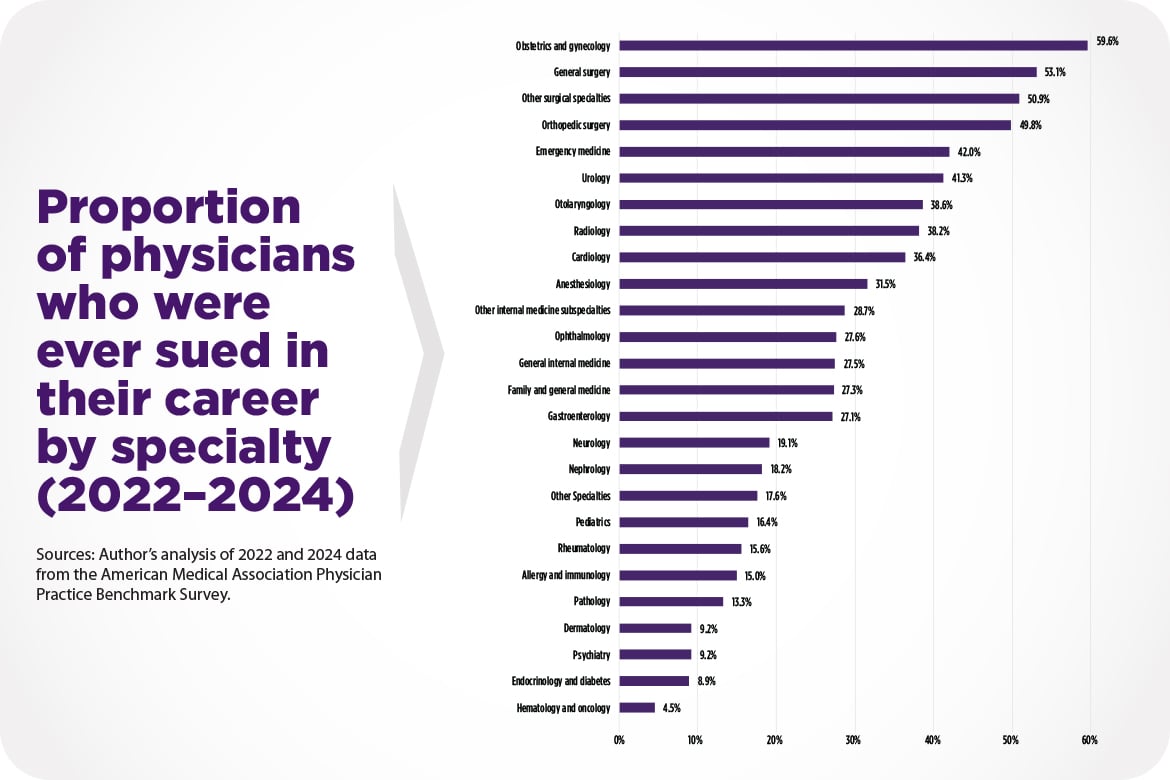
Using data from the AMA’s 2016-2024 Physician Practice Benchmark Survey, this report presents estimates of claim frequency among U.S. physicians and explores whether the likelihood of claims varies by age, gender, specialty, Census Division and employment status and how it’s changed over time. It finds that in 2024, 28.7% of physicians had been sued in their careers to date, a moderate decline from 34% in 2016. It also finds that the risk of ever being sued varies significantly by specialty, gender and age. Surgical specialties such as obstetrics and gynecology and general surgery are at the highest risk, and the risk increases the longer physicians are in practice.
Physician Compensation Methods: Although Salary-Based Models Dominate, Productivity-Based Models Remain Prominent
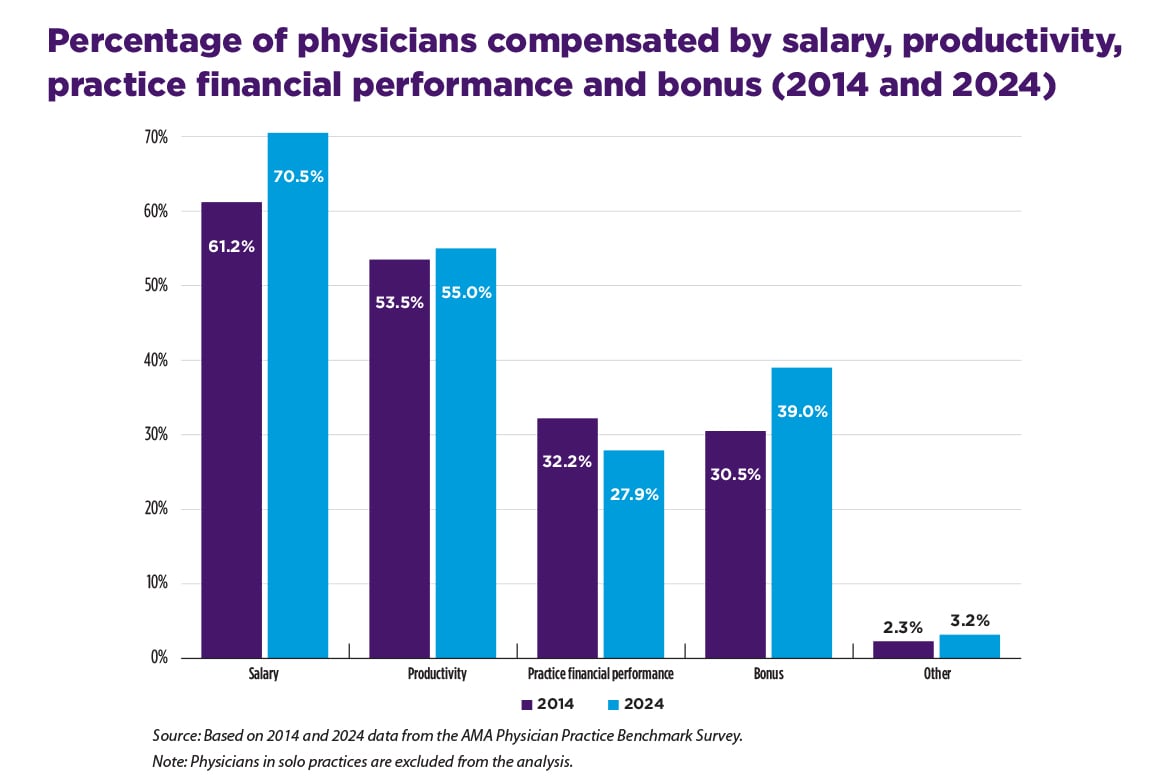
This report examines trends in methods used to compensate physicians—such as salary-based and productivity-based models—as well as differences in compensation methods across physician characteristics to provide a clearer understanding of the underlying factors that influence physician income. The findings reveal a significant move toward blended compensation models, with the percentage of physicians compensated by two or more methods increasing from 51.0% in 2014 to 60.8% in 2024. These blended models typically combine salary-based approaches with bonuses and/or productivity-based incentives. Salary is the dominant compensation method (70.5% of physicians received at least some compensation from this method in 2024) though productivity is still prominent in physician income (55.0% of physicians received at least some compensation tied to productivity in 2024). There were differences across physicians; male physicians, practice owners, surgical specialists, and those who worked in single-specialty practices tended to have a higher share of compensation from productivity and a lower share from salary compared to their counterparts. Overall, the trend towards blending salary-based and productivity-based models indicates that most physicians now benefit from the stability of a salary while maintaining the potential, albeit more modest, upside of their productivity.
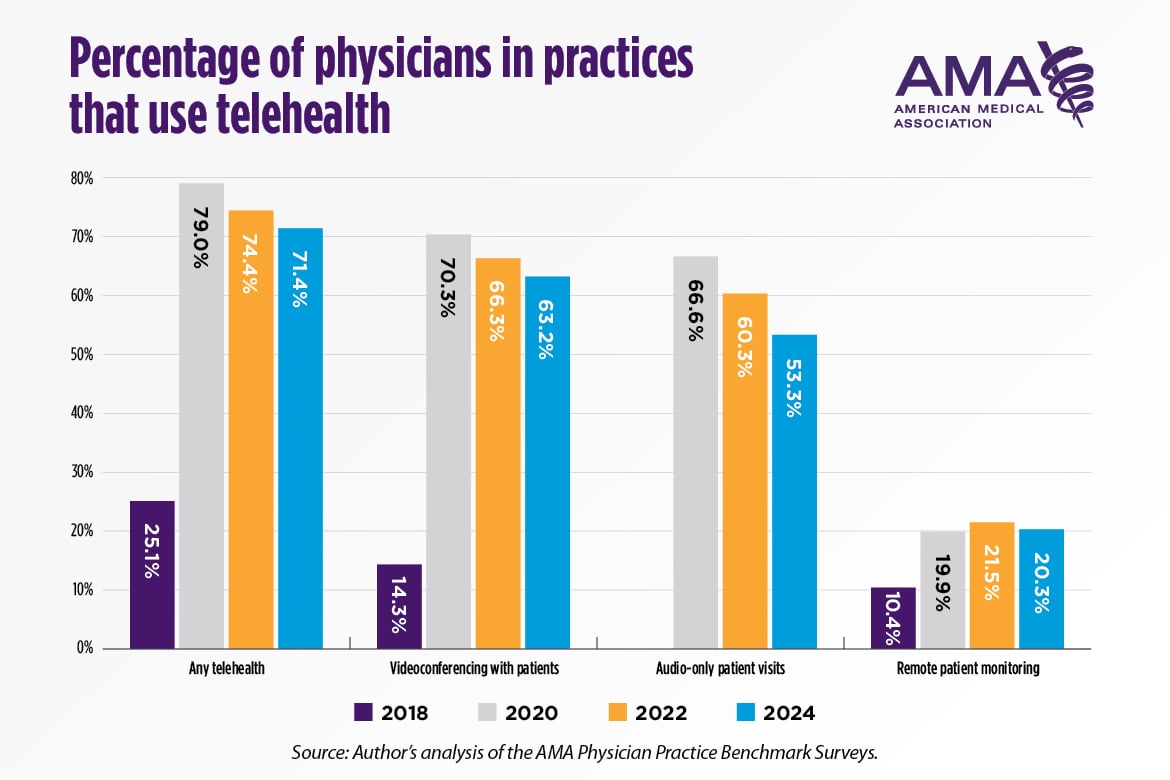
Patient-Facing Telehealth: Use Is Higher than Pre-Pandemic but With Great Variation Across Physician Specialties
This report (PDF) presents trends in the use of telehealth in physician offices since 2018. It also compares 2024 telehealth use among physicians in practices with different ownership structures and presents novel estimates on the reasons why physician practices are not using telehealth. Lastly, it compares the weekly use of telehealth across physician specialties. The percentage of physicians in practices that used telehealth increased from 25.1% in 2018 to 79.0% in 2020 and remained high, at 71.4%, in 2024. Physicians in hospital-owned practices were more likely to report the use of telehealth than physicians in private practice. For example, in 2024, 73.5% of physicians in hospital-owned practices said that videoconferencing with patients was used in their practice compared to only 58.3% of physicians in private practice. The top two reasons physicians gave for why their practices were not using videoconferencing or audio-only patient visits in 2024 was a lack of relevancy to the specialties in their practice and physician preference to treat patients in person. Financial considerations, although not leading reasons for either ownership category, were cited more often by physicians in private practice. Consistent with other research, the report finds that psychiatrists were high users of videoconferencing and audio-only for patient visits.
Alternative Payment and Delivery Models: A Decade in Review Shows Stagnant Growth Between 2014 and 2024
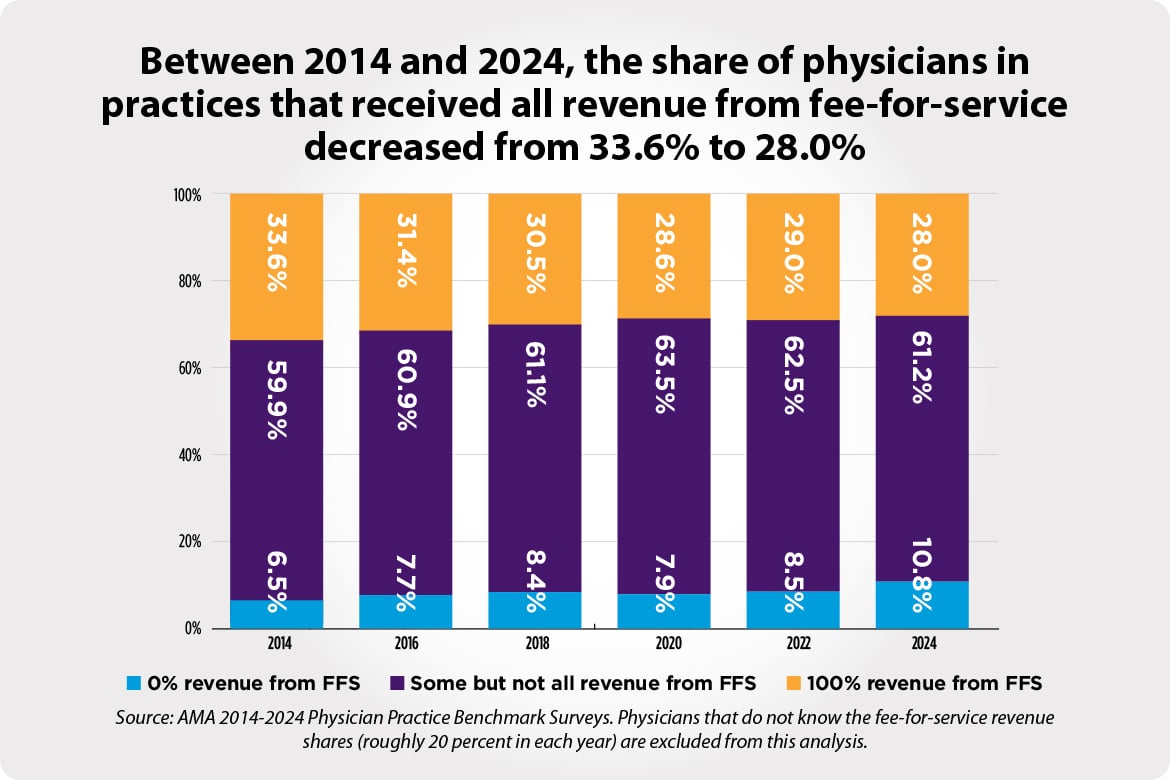
This report (PDF) examines the trends in participation in medical homes and Accountable Care Organizations (ACOs) as well as in the use of fee-for-service (FFS) and Alternative Payment Models (APMs) from 2014 to 2024. In 2024, participation in medical homes and each type of ACO declined or stagnated from 2022. For instance, 53.5% of physicians reported that their practice participated in at least one ACO type in 2024, down from 57.8% in 2022. However, participation in each ACO type remained higher than in 2014 (the earliest available data for Medicare ACOs) and 2016 (the earliest available data for Medicaid and commercial ACOs). The report also reveals notable differences in care delivery participation across practice characteristics. Shifting to payment methods that practices receive, FFS remained the most common method in 2024 as in previous years, despite the rising prevalence of APMs over the last decade. The data also reveal a declining trend in complete reliance on FFS, with more physicians reporting that their practices receive all revenue from APMs.
Physician Practice Characteristics in 2024: Private Practices Account for Less Than Half of Physicians in Most Specialties
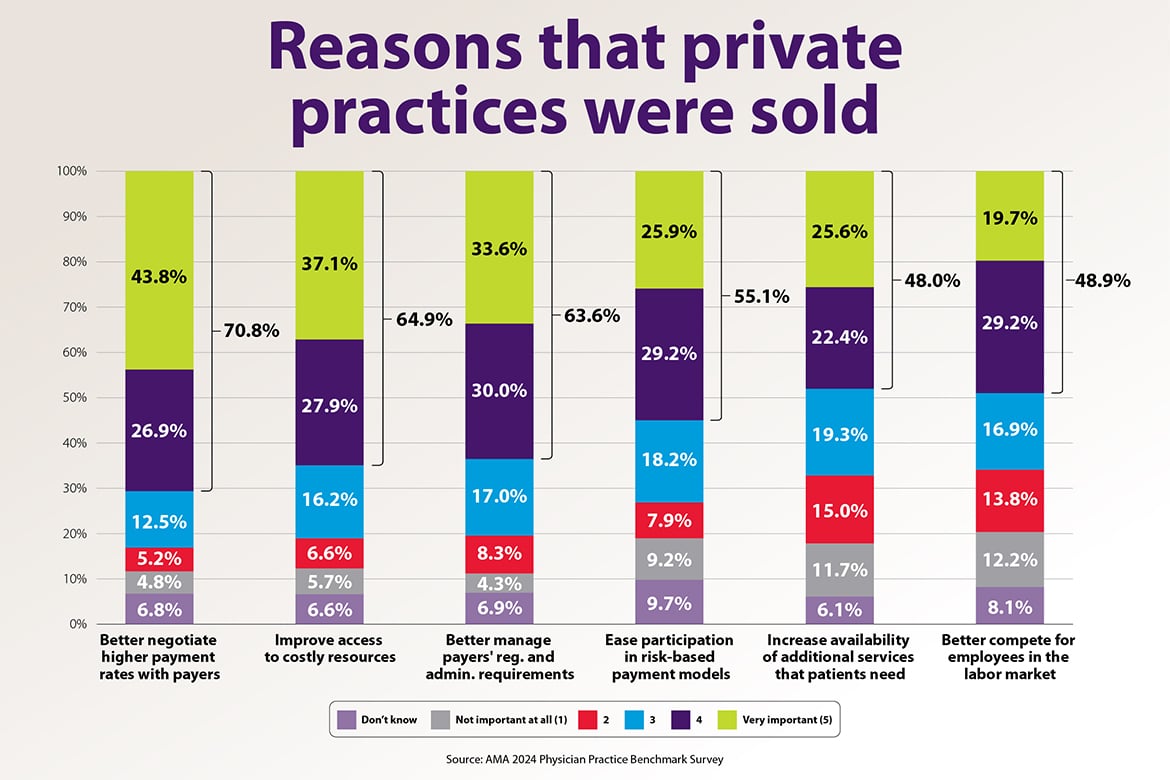
The report (PDF) describes the changes in the ownership and organization of physician practices since the first Benchmark Survey was fielded in 2012. The survey results show that physicians deliver care to patients in practices that are increasingly owned by hospitals or other organizations and not by physicians, larger, and increasingly likely to include physicians in a variety of specialties, not just one. For example, between 2012 and 2024, the share of physicians who work in private practices dropped by 18 percentage points from 60.1% to 42.2%. The report also describes the size and composition differences between private practices and those that are hospital-owned or owned by a private equity firm. Lastly, it explores the reasons that private practices are sold to hospitals, private equity firms, or insurers and finds that inadequate payment rates, costly resources, and burdensome regulatory and administrative requirements are longstanding and important drivers of this change.
Download the PDF of the chart.
2012-2022 Physician Practice Benchmark Surveys
- 2022 survey
- Physician Compensation 2012-2022: Physicians Increasingly Compensated Through Multiple Methods (PDF)
- Telehealth in 2022: Availability Remains Strong but Accounts for a Small Share of Patient Visits for Most Physicians (PDF)
- Payment and Delivery in 2022: Continued Growth in Accountable Care Organization While Alternative Payment Methods Stagnate (PDF)
- Recent Changes in Physician Practice Arrangements: Shifts Away from Private Practice and Towards Larger Practice Size Continue Through 2022 (PDF)
- Medical Liability Claim Frequency Among U.S. Physicians (PDF)
- 2020 survey
- Physician Compensation Methods: The Combination of Salary and Bonus Continues to Dominate through 2020 as Physicians are Increasingly Paid by Multiple Methods (PDF)
- Payment and Delivery in 2020: Fee-for-Service Revenue Remains Stable While Participation Shifts in Accountable Care Organizations During the Pandemic (PDF)
- Telehealth in 2020: Survey Data Show Widespread Use Across Most Physician Specialties and for a Variety of Functions (PDF)
- Recent Changes in Physician Practice Arrangements: Private Practice Dropped to Less Than 50 Percent of Physicians in 2020 (PDF)
- 2018 survey
- 2012-2018 Data on Physician Compensation Methods: Upswing in Compensation through the Combination of Salary and Bonus (PDF)
- Payment and Delivery in 2018: Participation in Medical Homes and Accountable Care Organizations on the Rise While Fee-for-Service Revenue Remains Stable (PDF)
- Updated Data on Physician Practice Arrangements: For the First Time, Fewer Physicians are Owners Than Employees (PDF)
- 2016 survey
- How Are Physicians Paid? A Detailed Look at the Methods Used to Compensate Physicians in Different Practice Types and Specialties (PDF)
- Updated Data on Physician Practice Arrangements: Physician Ownership Drops Below 50 Percent (PDF)
- Medical Liability Claim Frequency among U.S. Physicians (PDF)
- Payment and Delivery in 2016: The Prevalence of Medical Homes, Accountable Care Organizations, and Payment Methods Reported by Physicians (PDF)
- Physicians’ Patient Mix–A Snapshot from the 2016 Benchmark Survey and Changes Associated with the ACA (PDF)
- 2014 survey
- How Are Physicians Paid? A Detailed Look at the Methods Used to Compensate Physicians in Different Practice Types and Specialties (PDF)
- Payment and Delivery in 2014: The Prevalence of New Models Reported by Physicians (PDF)
- Updated Data on Physician Practice Arrangements: Inching Toward Hospital Ownership (PDF)
- 2012 survey