
AMA Update
What you need to know about bird flu

Practice Management
Change Healthcare outage leaves physician practices reeling
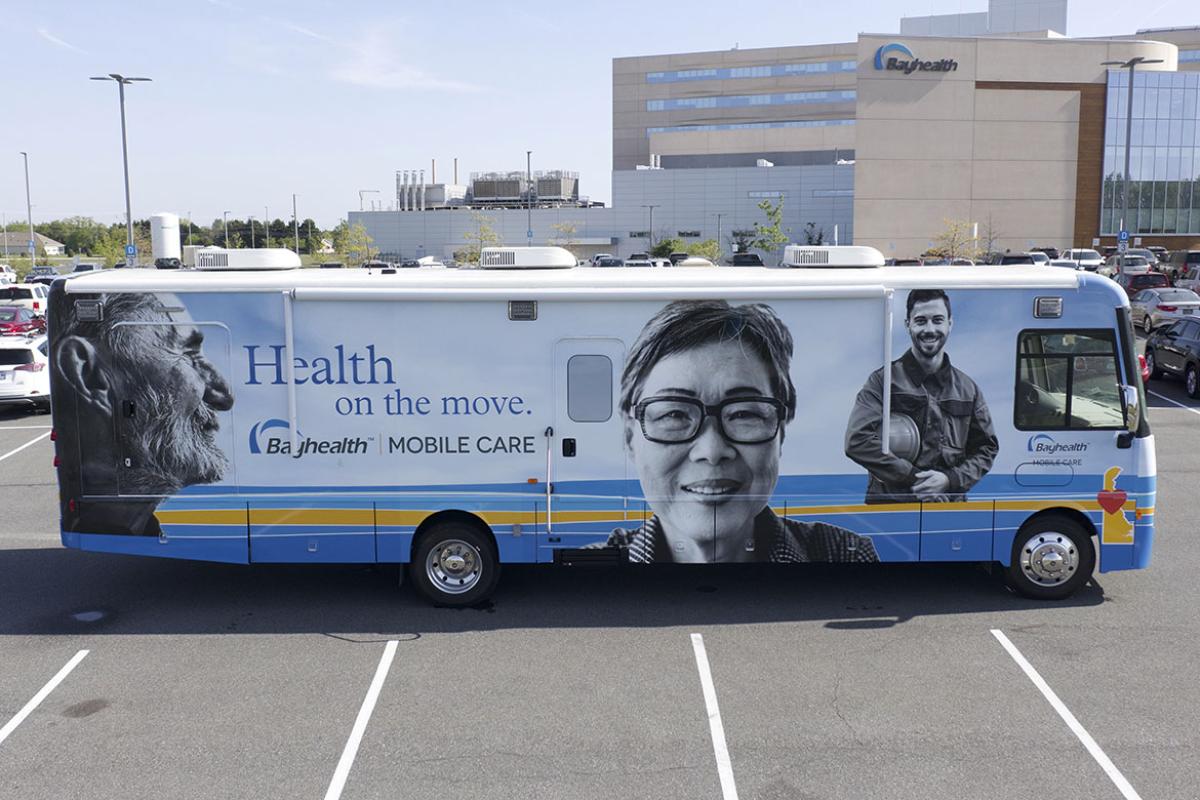
Health System Spotlight
RVs aren’t just for camping: Bringing the clinic to the community

Recovery Plan for Physicians
Physicians now spend more “pajama time” on mandatory trainings
- What illnesses are going around? RSV, COVID-19, influenza, measles outbreak, plus avian flu news
- Change Healthcare cyber outage
- What doctors wish patients knew about the contagious norovirus
- What doctors wish patients knew about strep throat
- These 3 action steps can help improve blood pressure control
Free CME for Members
AMA Recovery Plan for America’s Physicians
About the recovery plan
You took care of the nation. It’s time for the nation to take care of you. It’s time to rebuild. And the AMA is ready.
Learn moreFixing prior authorization
We’re standing up to insurance companies to eliminate care delays, patient harm and practice hassles.
Learn moreReforming Medicare payment
The evidence is clear. The Medicare payment system is on an unsustainable path, threatening patients' access to physicians.
Learn more
Fighting scope creep
Patients deserve care led by physicians—the most highly educated, trained and skilled health care professionals.
Learn moreSupporting telehealth
The AMA is fighting for legislation to permanently fix the restrictions on telehealth coverage and payment.
Learn moreReducing physician burnout
We are focused on removing administrative burdens, providing real-world solutions and helping physicians rediscover the joy in health care.
Learn moreMember benefits: Exclusive savings & resources

6 reasons to join the AMA
By becoming a member, you can play a role in shaping the future of medicine while growing professionally, no matter where you are in your training and career.
Learn moreAuto & transportation
AMA membership makes you eligible for exceptional savings on a host of impressive Mercedes-Benz and Volvo vehicles.
Learn moreHome & lifestyle offers
Find and purchase a new home, refinance an existing mortgage or protect your home with professional monitoring.
Learn more
Med student membership
Find leadership and advocacy opportunities, get test prep, showcase your research, and take advantage of discounts and benefits designed just for you.
Learn moreLoans & financial services
Whether it's a home, student, resident or personal loan or insurance, AMA provides the information to align your finances, and prepare for your future.
Learn moreAMA Annual Meeting
Event InformationAnnual Meeting of the House of Delegates
June 7-12, 2024
Member Groups (Sections) Meetings
June 6-7, 2024
Annual Meeting of the House of Delegates
June 7-12, 2024
Future HOD Meeting Dates
More InfoAMA Morning Rounds
Get your daily dose of medical news
The biggest stories in medicine and public health delivered right to your inbox.
Essential Tools & Resources for You
Advocating for Physicians
FREIDA™, the AMA Residency and Fellowship Database®
Save, rank, take notes, download and compare programs.
Access FREIDA. Find your Match.Your Membership Moves Medicine™
Join the AMA todayRaising the Voice of Our Members

Dhara Amin, MD
Thank you @AmerMedicalAssn and the Center of Health Equity for the opportunity to share my perspective! @DrAlethaMaybank @AllysonBelton @jmorijohnson @SatcherHealth @MSMEDU @CookCtyHealth @CookCountyEM
Visit Dr. Amin on X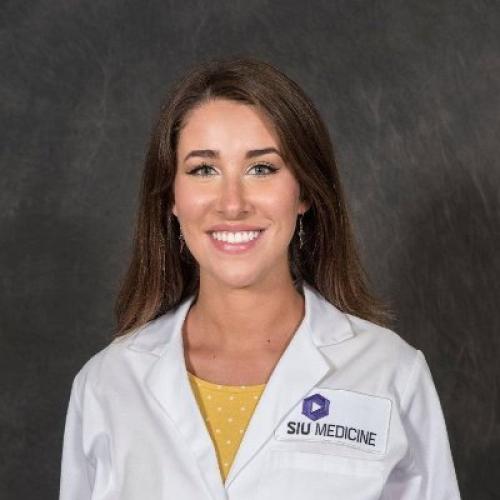
Emma Johns
The 30th edition of SCOPE, SIU School of Medicine's Literary Arts Magazine was released today. I had the honor of being its Editor! So many amazing artists, photographers, and writers in our community!
Visit Emma Johns on X